The Shifting Economics of Global Manufacturing
How Cost Competitiveness Is Changing Worldwide
Following, you will find excerpts of the very interesting Boston Consulting Group study on global manufacturing.
For the better part of three decades, a rough, bifurcated conception of the world has driven corporate manufacturing investment and sourcing decisions. Latin America, Eastern Europe, and most of Asia have been viewed as low-cost regions. The U.S., Western Europe, and Japan have been viewed as having high costs.

But this worldview now appears to be out of date. Years of steady change in wages, productivity, energy costs, currency values, and other factors are quietly but dramatically redrawing the map of global manufacturing cost competitiveness. The new map increasingly resembles a quilt-work pattern of low-cost economies, high-cost economies, and many that fall in between, spanning all regions.
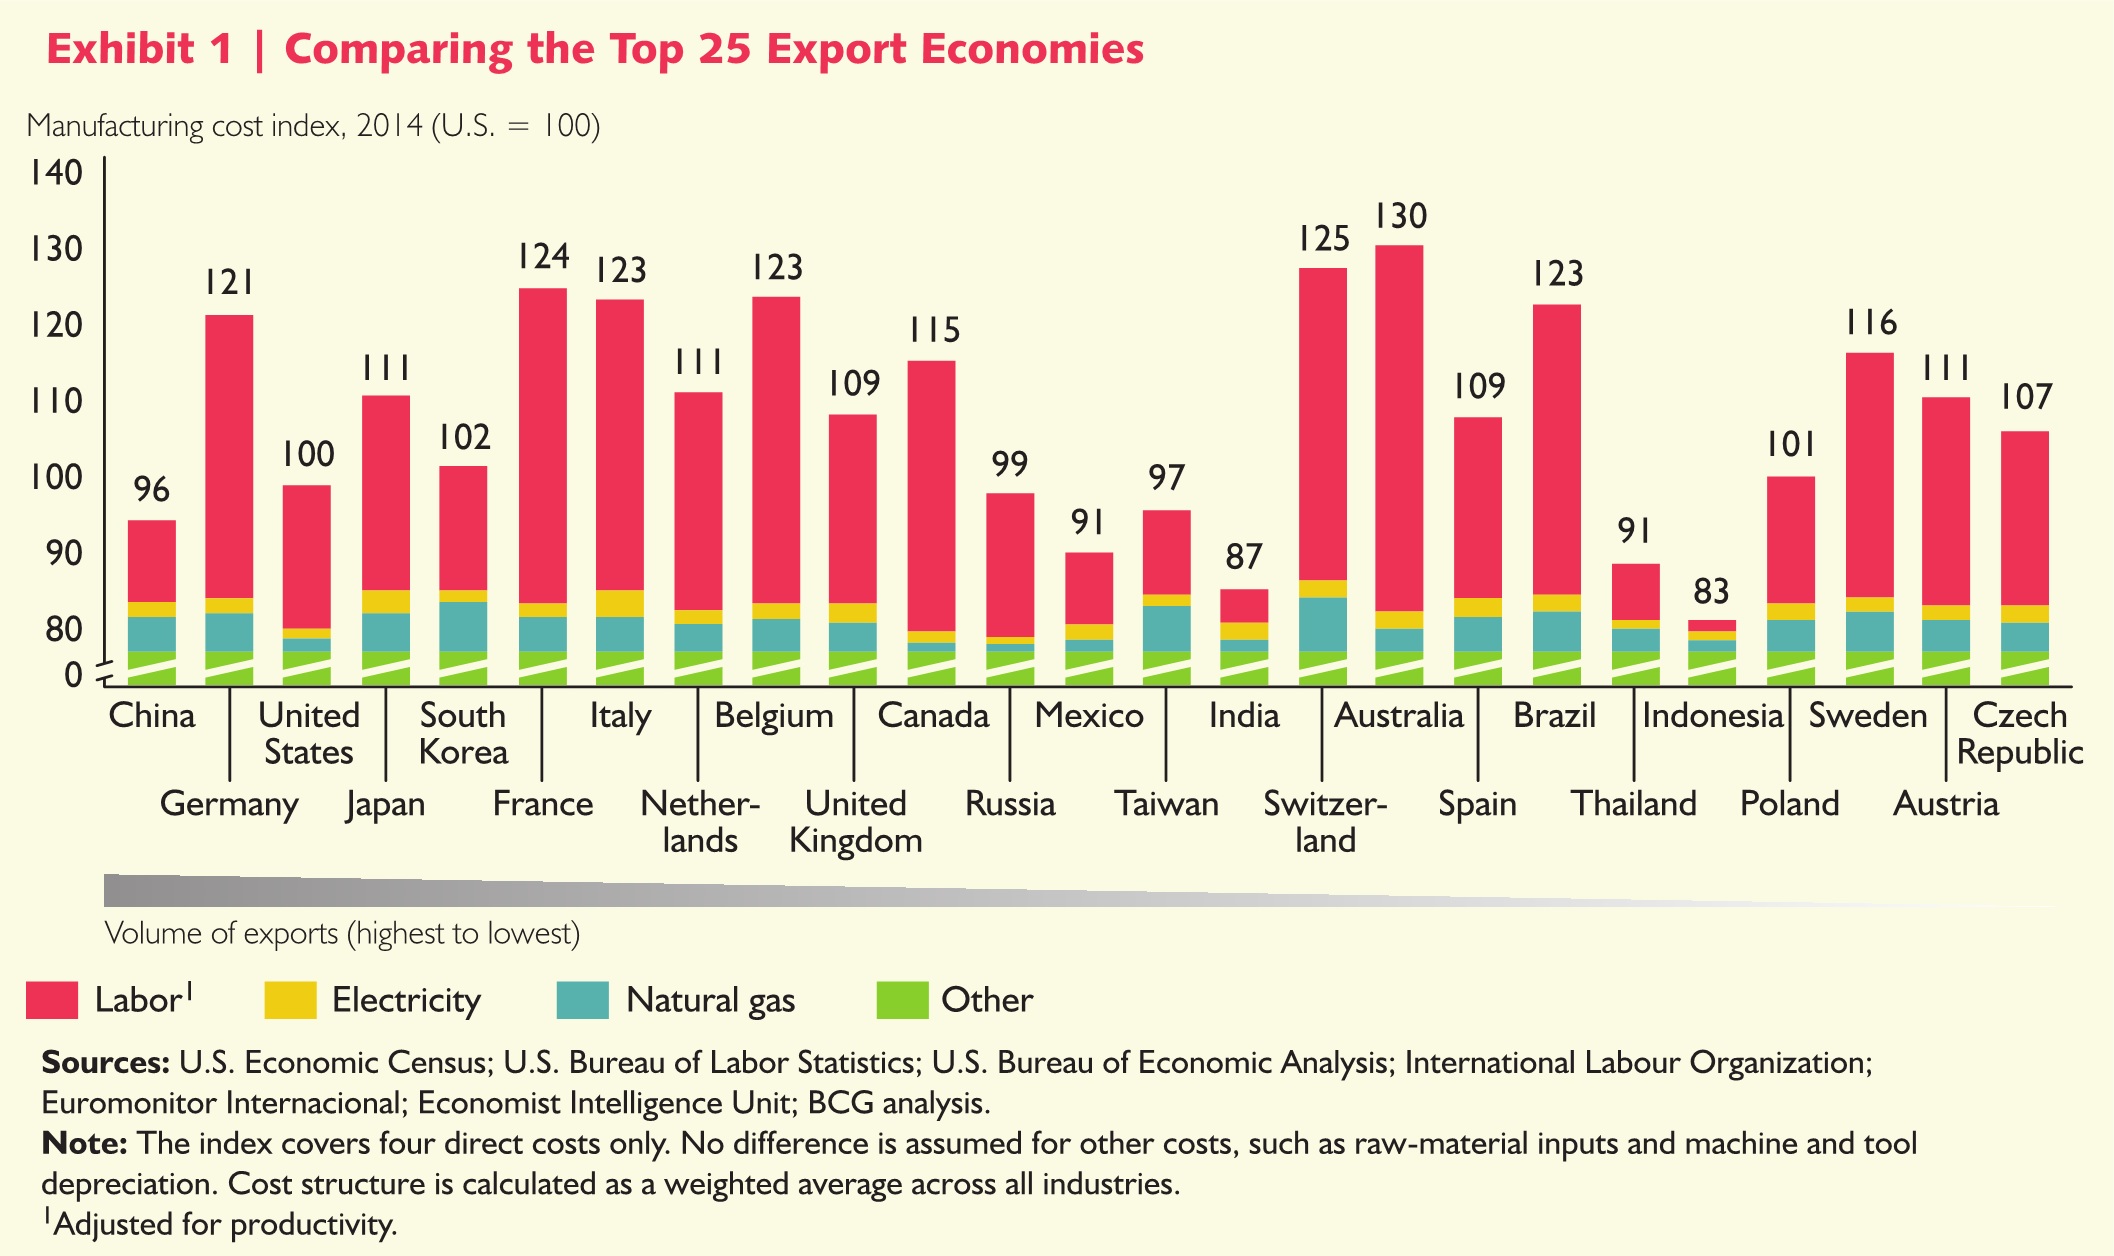
In some cases, the shifts in relative costs are startling. Who would have thought a decade ago that Brazil would now be one of the highest-cost countries for manufacturing—or that Mexico could be cheaper than China? While London remains one of the priciest places in the world to live and visit, the UK has become the lowest-cost manufacturer in Western Europe. Costs in Russia and much of Eastern Europe have risen to near parity with the U.S. (See Exhibit 1)
To understand the shifting economics of global manufacturing, The Boston Consulting Group analyzed manufacturing costs for the world’s 25 leading exporting economies along four key dimensions: manufacturing wages, labor productivity, energy costs, and exchange rates. These 25 economies account for nearly 90 percent of global exports of manufactured goods.
The new BCG Global Manufacturing Cost-Competitiveness Index has revealed shifts in relative costs that should drive many companies to rethink decades-old assumptions about sourcing strategies and where to build future production capacity. To identify and compare the shifts in relative costs, we analyzed data in 2004 and 2014. The evaluation is part of a series of findings from our ongoing research into the shifting economics of global manufacturing.
In developing the index, we observed that cost competitiveness has improved for several countries and become relatively less attractive for others. Within the index, we identified four distinct patterns of change in manufacturing cost competitiveness. (See Exhibit 2) They include the following:
• Under Pressure. Several economies that traditionally have been regarded as low-cost manufacturing bases appear to be under pressure as a result of a combination of factors that have significantly eroded their cost advantages since 2004. For example, at the factory gate, China’s estimated manufacturing-cost advantage over the U.S. has shrunk to less than 5 percent. Brazil is now estimated to be more expensive than much of Western Europe. Poland, the Czech Republic, and Russia have also seen their cost competitiveness deteriorate on a relative basis. They are now estimated to be at near parity with the U.S. and only a few percentage points cheaper than the UK and Spain.
• Losing Ground. Several traditional high-cost countries that were already relatively expensive a decade ago have lost additional ground, resulting in 16 to 30 percent cost gaps relative to the U.S. This is largely because of weak productivity growth and rising energy costs. The countries losing ground include Australia, Belgium, France, Italy, Sweden, and Switzerland.
• Holding Steady. From 2004 to 2014, the manufacturing cost competitiveness of a handful of countries held steady relative to the U.S. Rapid productivity growth and depreciating currencies have helped keep costs in check in economies such as India and Indonesia—even as wages have grown quickly. In contrast to the dynamic changes in India and Indonesia, the Netherlands and the UK have seen relative stability across all the cost drivers we examined. The performance of these four countries has positioned them as potential future leaders in each of their respective regions.
• Rising Global Stars. Cost structures in Mexico and the U.S. improved more than in all of the other 25 largest exporting economies. Because of low wage growth, sustained productivity gains, stable exchange rates, and a big energy-cost advantage, these two nations are the current rising stars of global manufacturing. We estimate that Mexico now has lower average manufacturing costs than China on a unit-cost basis. And except for China and South Korea, the rest of the world’s top-ten goods exporters are 10 to 25 percent more expensive than the U.S.
These dramatic changes in relative costs could drive a large shift in the global economy as companies are prompted to reassess their manufacturing footprints. (See Exhibit 3) One implication is that global manufacturing could become increasingly regional. Because relatively low-cost manufacturing centers exist in all regions of the world, more goods consumed in Asia, Europe, and the Americas will be made closer to home. These trends also have implications for governments, whose leaders increasingly recognize the economic importance of a stable manufacturing base. We hope that this report will encourage policy makers in developed and developing economies alike to identify growing areas of strength and weakness and take action to shore up their manufacturing competitiveness.

Forces That Are Redrawing the Competitivess Map
Four factors are most responsible for the dramatic shifts in manufacturing competitiveness from 2004 to 2014. (See Exhibit 4) The factors are now blurring the traditional boundaries between low-cost and high-cost regions.
• Wages. The range of hourly pay differentials for manufacturing workers remains enormous. But rapidly rising wages have significantly eroded the competitive advantage of a number of major exporters. Although manufacturing wages rose in all 25 countries from 2004 to 2014, nations such as China and Russia have experienced more than a decade of annual increases ranging from 10 to 20 percent. In other economies, wages have only risen by 2 to 3 percent per year.
• Exchange Rates. Changing currency values can make an economy’s exports either more expensive or cheaper in international markets. Currency shifts from 2004 to 2014 have ranged from a nearly 26 percent devaluation of the Indian rupee against the U.S. dollar to a 35 percent increase in the Chinese yuan.

• Labor Productivity. Gains in output per manufacturing worker—or productivity—have varied widely around the world from 2004 to 2014 and explain some of the biggest shifts in total manufacturing costs. Manufacturing productivity rose by more than 50 percent in countries such as Mexico, India, and South Korea from 2004 to 2014 but shrank in others, such as in Italy and Japan. Some economies with low wage rates are not particularly competitive in terms of unit labor costs when wages are adjusted for productivity.

• Energy Costs. Prices for natural gas have fallen by 25 to 35 percent since 2004 in North America because of large-scale production of shale gas resources. In contrast, they have risen by 100 to 200 percent in economies such as Poland, Russia, South Korea, and Thailand. This has had a significant impact on the chemicals industry, which uses natural gas as a feedstock for production. Likewise, the industrial price of electricity has risen sharply in manufacturing economies such as Australia, Brazil, and Spain. As a result, overall energy costs in many countries outside of North America are between 50 to 200 percent higher than they were in 2004. This has caused major changes in competitiveness in energy-dependent industries.
by Harold L. Sirkin, Michael Zinser, and Justin Rose